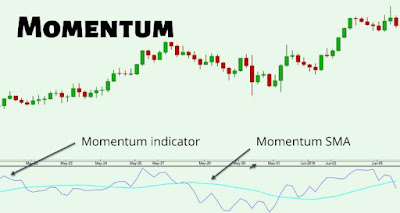
The Momentum Indicator
The Momentum indicator is a popular technical analysis tool used to measure the rate of change of an asset's price. It provides insights into the strength and speed of a price movement, helping traders identify potential buying or selling opportunities. The Momentum indicator is widely utilized in various financial markets, including stocks, commodities, and currencies.
To calculate the Momentum indicator, the closing price of an asset is compared to its previous closing price over a specific time period. The difference between the current closing price and the previous closing price is plotted on a chart, creating a line that oscillates around a zero line. Positive values indicate upward momentum, while negative values indicate downward momentum.
The Momentum indicator is often displayed as a single line chart, although some traders prefer to add a signal line to generate trading signals. The signal line is usually a moving average of the Momentum line, smoothing out the fluctuations and providing a clearer indication of the overall trend.
The Momentum indicator offers several key insights into market dynamics. First, it helps traders identify overbought and oversold conditions. When the Momentum line reaches extreme levels, such as high positive values for an uptrend or low negative values for a downtrend, it suggests that the price movement may be nearing exhaustion, and a reversal or correction could be imminent.
Second, the Momentum indicator can be used to confirm trends. When the Momentum line aligns with the direction of the price trend, it provides confirmation of the trend's strength. For example, in an uptrend, the Momentum line should generally be positive, indicating upward momentum. If the Momentum line starts to diverge from the price trend, it may suggest a potential weakening of the trend.
Third, the Momentum indicator can help identify bullish and bearish divergences. Divergences occur when the price movement and the Momentum line move in opposite directions. For example, if the price of an asset is making higher highs while the Momentum line is making lower highs, it indicates a bearish divergence and warns of a possible trend reversal.
It is important to note that the interpretation of the Momentum indicator should be done in conjunction with other technical analysis tools and indicators to reduce false signals and increase accuracy. Traders often combine the Momentum indicator with trend lines, moving averages, or other oscillators to gain a comprehensive view of the market.
When using the Momentum indicator, it is essential to select an appropriate time period that suits the trading strategy and timeframe. Shorter time periods, such as 14 or 21 days, are often used for intraday or short-term trading, while longer time periods, such as 50 or 200 days, are more suitable for identifying long-term trends.
In conclusion, the Momentum indicator is a valuable tool for technical analysis, providing insights into the rate of change and strength of price movements. By identifying overbought and oversold conditions, confirming trends, and detecting divergences, traders can make more informed trading decisions. It is important to understand that the Momentum indicator is not a standalone tool but should be used in conjunction with other analysis techniques for better accuracy and reliability.


