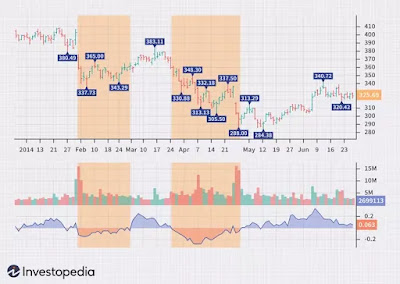
The Chaikin Money Flow Indicator
The Chaikin Money Flow (CMF) indicator is a technical analysis tool used to measure the accumulation and distribution of money flow in a particular financial instrument. It was developed by Marc Chaikin and is widely used by traders and investors to assess the buying and selling pressure in the market.
The CMF indicator combines both price and volume data to provide insights into the strength and direction of the money flow. It calculates the CMF line by multiplying the volume of a period by the difference between the closing price and the midpoint of the high and low price for that period. The resulting values are then accumulated over a specified period and plotted on a chart.
The CMF indicator is typically displayed as a line chart that oscillates around a zero line. Positive values above the zero line indicate buying pressure, while negative values below the zero line indicate selling pressure. Traders use the CMF indicator to identify potential reversals, confirm trends, and detect divergences between price and volume.
The CMF indicator offers several key insights into market dynamics. First, it helps traders assess the strength of a trend. When the CMF line is above zero and rising, it suggests strong buying pressure and confirms an uptrend. Conversely, when the CMF line is below zero and falling, it indicates strong selling pressure and confirms a downtrend.
Second, the CMF indicator can be used to identify potential reversals. Divergences between the CMF line and price often indicate a change in trend direction. For example, if prices are making new highs while the CMF line is making lower highs, it suggests weakening buying pressure and a possible trend reversal.
Third, the CMF indicator helps traders assess the buying and selling pressure within a specific time frame. High CMF values indicate strong buying pressure, suggesting that investors are accumulating the asset. Low CMF values, on the other hand, indicate strong selling pressure, suggesting that investors are distributing the asset.
The CMF indicator can be applied to various financial instruments, including stocks, commodities, and currencies. Traders can customize the period over which the CMF is calculated, allowing them to adapt the indicator to different trading strategies and timeframes.
To use the CMF indicator effectively, traders often combine it with other technical analysis tools and indicators. For example, they may look for confirmation signals from trend lines, moving averages, or other momentum oscillators.
In conclusion, the Chaikin Money Flow (CMF) indicator is a popular technical analysis tool used to assess the accumulation and distribution of money flow in financial markets. By combining price and volume data, the CMF indicator provides valuable insights into buying and selling pressure, trend strength, and potential reversals. Traders can incorporate the CMF indicator into their analysis to make informed trading decisions and enhance their overall trading strategies.


