Unleashing the Power of Bollinger Bands
Discover the Bollinger Bands indicator and elevate your trading strategies. Bollinger Bands provide valuable insights into price volatility and help traders identify potential entry and exit points.
Understanding Bollinger Bands
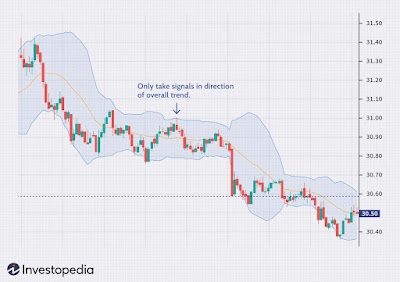
Bollinger Bands consist of three lines: the upper band, the lower band, and the middle band. The middle band is typically a simple moving average, while the upper and lower bands are calculated based on the standard deviation of price fluctuations. Bollinger Bands dynamically adjust to market conditions, expanding during periods of high volatility and contracting during periods of low volatility.
Interpreting Bollinger Bands
When price moves close to the upper band, it indicates that the market is potentially overbought. Conversely, when price approaches the lower band, it suggests that the market is potentially oversold. Traders can use these indications to identify potential reversals or trend continuations.
Volatility Squeeze and Breakout Opportunities
Bollinger Bands are particularly useful for identifying volatility squeezes and potential breakout opportunities. When the bands contract, it signifies reduced volatility. Traders anticipate an imminent price breakout when the bands contract significantly. This can be a valuable signal to enter a trade in anticipation of a significant price move.
Bollinger Bands as Support and Resistance Levels
Bollinger Bands can also act as dynamic support and resistance levels. When price bounces off the lower band, it suggests potential support, while a bounce off the upper band indicates potential resistance. These levels can be used in combination with other technical analysis tools to confirm trade signals.
Combining Bollinger Bands with Other Indicators
The Bollinger Bands indicator can be combined with other technical indicators to enhance trading strategies. For example, combining Bollinger Bands with oscillators like the Relative Strength Index (RSI) or the Stochastic Oscillator can provide additional confirmation for trade entries and exits.
Risk Management with Bollinger Bands
Bollinger Bands can assist in risk management by providing a visual representation of market volatility. Traders can adjust their position sizes or set stop-loss orders based on the width of the bands. Wider bands indicate higher volatility, suggesting the need for smaller position sizes and wider stop-loss levels.
Conclusion
Bollinger Bands are a powerful tool for traders seeking to gauge volatility, identify potential reversals or breakouts, and make well-informed trading decisions. By understanding how to interpret Bollinger Bands and incorporating them into your trading strategies, you can gain a competitive edge in the market and improve your overall trading performance.


